How to Build a Replacement Wear Parts Strategy Around a Mixed Equipment Fleet
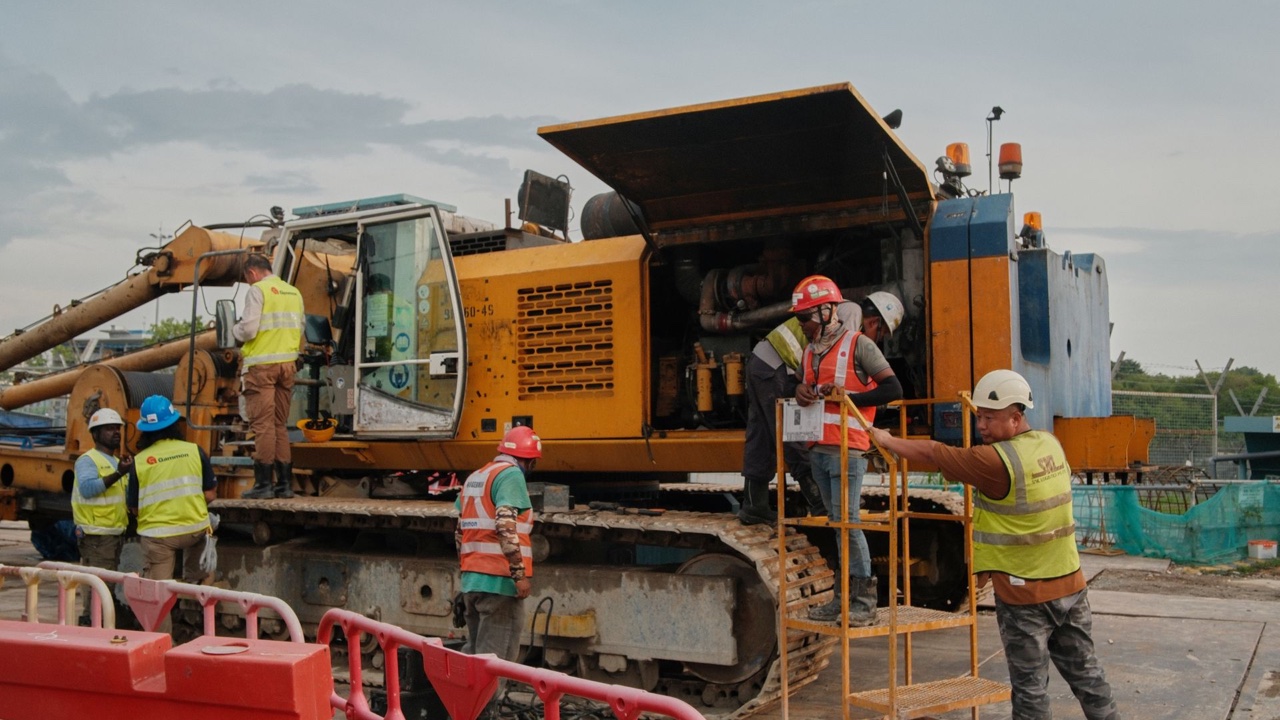
A mixed fleet creates wear parts headaches that a uniform fleet doesn’t have. Different machine models, different cutting head designs, different tooth or tip configurations — parts that work for one machine don’t transfer to another, and stocking adequate inventory for each becomes progressively more complicated as the fleet diversifies. Operators who try to manage mixed-fleet wear parts the same way they’d manage a single-machine operation end up either over-stocked with parts that sit unused or under-stocked at the moments they need something most.
The alternative is a deliberate strategy built around the specific machines in the fleet and the work they’re doing.
Map What Each Machine Actually Consumes
The foundation of any mixed-fleet parts strategy is consumption data by machine. Not estimated consumption — actual records of what comes off each machine, per operating hour, under the conditions it’s actually working in.
This data usually doesn’t exist in clean form in mixed operations. It has to be built. The practical way to start is to assign each machine a simple log — paper works fine — where the service technician records every part removed and every part installed, along with the operating hour reading. After a few months of consistent logging, patterns emerge: this machine goes through saw teeth at X per hour when cutting hardwood and Y per hour on softwood; that machine uses hammer sets at a rate that’s higher than the comparable machine, which might indicate the feedstock is harder or that something in the feed system needs attention.
The consumption data does two things. It gives accurate inputs for calculating minimum stock levels — instead of guessing how many tips to keep on hand, the calculation is based on actual burn rate and lead time. And it surfaces anomalies: consumption rates that diverge from the expected pattern often indicate something worth investigating, whether that’s a maintenance issue, a change in feedstock, or a parts specification problem.
Identify What Can Be Standardized
Most mixed fleets have more standardization potential than their operators realize. The constraint is usually that different machine manufacturers use different specifications for teeth, tips, and holders — but within machines of the same make and model, parts are interchangeable, and sometimes across models from the same manufacturer if the cutting head configuration is the same.
Before accepting that every machine needs its own parts silo, audit what’s actually required across the fleet. Which machines use interchangeable parts? If two machines use the same tip holder configuration, they can draw from a common pool. If three machines use the same hammer specification, a single safety stock covers all three instead of three separate buffers.
Even partial standardization simplifies the inventory problem substantially. A fleet where four out of six machines share a common tooth specification is much easier to manage than one where every machine needs its own supply. When replacing cutting heads or making capital decisions about new equipment, the parts standardization question is worth considering alongside the machine performance question — a fleet that converges on fewer configurations over time has lower inventory carrying costs and better parts availability.
Structure Inventory by Location, Not by Machine
The instinct in a multi-machine operation is to assign parts to machines: machine A’s teeth go in machine A’s parts box, machine B’s in machine B’s. This feels organized but causes the inventory fragmentation problem — surplus at one machine doesn’t help a shortage at another, and the total inventory needed to protect against stockouts at any single machine is higher than it would be if the inventory were pooled.
A better structure is location-based: what’s at the machine (immediate access for the operator), what’s in the field service truck (for same-day service without a yard run), and what’s at the yard (replenishment stock). Replenishment flows from yard to truck to machine. Stock levels are maintained at each tier based on lead times to the next tier, not on arbitrary quantities per machine.
For replacement wear parts that are shared across multiple machines, the yard stock functions as a common pool. The total quantity needed to protect against stockouts across the fleet is lower than the sum of per-machine safety stocks, because the variability in consumption across the fleet is lower than the variability per machine — some machines will be running slower than average while others run faster, and the pool absorbs that variation.
Set Reorder Points From Consumption Data
A reorder point is the stock level that triggers a replenishment order — the quantity at which an order must be placed to replenish before stock hits zero, accounting for lead time from the supplier.
The formula is: reorder point = (daily consumption rate × supplier lead time in days) + safety buffer.
The safety buffer is what protects against variation in consumption rate and supplier lead time. For a critical wear part in a continuous operation, a safety buffer of 20–30% of the lead time demand is reasonable. For parts with longer lead times or more variable consumption, a larger buffer is appropriate.
In a mixed fleet, this calculation runs per part number. Parts shared across machines use a fleet aggregate consumption rate. Parts specific to one machine use that machine’s individual rate. The reorder points get updated when consumption data changes — when a machine moves to a different material, when a cutting head is reconfigured, when the operating utilization rate changes substantially.
The most common failure mode for this system is that the consumption data doesn’t get updated. The reorder points get set once based on current conditions, and then conditions change but the reorder points don’t. Building a review cycle into the process — updating consumption data and recalculating reorder points quarterly, or whenever a significant operational change happens — keeps the system calibrated.
Factor in Supplier Lead Time Variability
Lead time from the supplier isn’t always what the nominal value says. Most suppliers have a standard lead time that reflects average performance, but actual lead times vary. Demand spikes, manufacturing lead times on specific SKUs, shipping delays — all of these cause actual lead times to exceed the stated lead time on occasion.
For a mixed fleet that depends on reliable parts availability to maintain utilization, the question isn’t just what the average lead time is — it’s what the worst-case lead time looks like and how often it occurs. A supplier whose stated lead time is 3 days but who occasionally runs 10 days on specific items requires a larger safety buffer than one whose lead time is consistently 4 days.
This is one reason why a single primary supplier relationship with good visibility into their stocking practices is often preferable to spreading orders across multiple suppliers for price. A supplier managing meaningful volume of your SKUs is more likely to maintain reliable stock than one who treats your orders as low-priority spot purchases.
Keep the Strategy Current
Wear parts strategy isn’t set-and-forget. Fleets change — machines get added, removed, or reconfigured. Operating conditions change — a new job site with different material means different consumption rates. Suppliers change — lead times shift, pricing changes, specific SKUs become more or less available.
The strategy needs a process owner: someone responsible for reviewing consumption data, updating reorder points, evaluating supplier performance, and flagging when the strategy is drifting out of calibration with current conditions. In a larger operation, that’s a dedicated parts manager or purchasing role. In smaller operations, it’s usually the shop foreman or a senior technician who takes on the function alongside other responsibilities.
The operations that manage wear parts costs most effectively aren’t usually the ones with the most sophisticated software or the most complex inventory systems. They’re the ones that consistently track what they consume, stock parts based on real data rather than guesses, and treat parts strategy as an ongoing process rather than a one-time decision.